Monitors defined paths for changes based on user defined metadata
FileMonitor
Added LogUser parameter
Added EventTriggers
FileTail
Added HistoryDays and HistoryRemoveEmptyDirectories parameters
Heartbeat
Added LogsError reporting
Logging
Add SIDFields parameter
LogRouting
Added ADHarvest as a way to define network location IP ranges
Added RELP protocol support
Logs
Added support for XPath event log query definitions
RegistryMonitor
Added SID resolution for HKEY_USER definitions
Added Enable parameter for hive subitems
SessionMonitor
Added GroupSIDs parameter – replaces PKINIT field
Added UserNameHint field
ServiceMonitor
Added Security field based on registry data
What’s Changed?
FileMetadata
ImpHash calculations now ignore empty function names
FileTail
Deprecated IncludeSubdirectories. See Depth.
Filter supports multiple values and regular expressions
LogRouting
Where possible, BufferedStream is now used
Logs
Event logs that are null when received are counted as errors
TaskMonitor
Added Task Trigger XML to log
WLS Records
All control characters are now sanitized from field names and values
Fixes!
ARP/DNS
Fixed updating interval when changed while running
Audio
Fixed being enabled when disabled if FullReportInterval was set
CommandMonitor
Added extra checks when scanning memory for history structures to prevent errors
FileMetadata
Fixed quoted path loop bug
FileTail
BufferSize set as expected
Ensure file position is set to 0 on creation
Improved file position tracking
Reading multiple %USERPROFILE% settings
Setting CharSize
LNK
Fixed string decoding
Updated Enums and reporting of unknown values
LogFormat
Fixed appending HMAC
RemoteConfiguration
Fixed requiring rules.xml when not needed
ServiceMonitor
Fixed reporting at Interval
If you’d like licensing or other information about WLS, send me a note via the contact form. WLS is currently available to US entities, but does require a signed license agreement.
Building on the existing reporting of the TPM status and certificates, WLS now has the ability to report the Windows Boot Configuration Log, also known as the Trusted Computing Group (TCG) measured boot logs. This is the same information used to perform Device Health Attestation (DHA) and that is logged at %windir%\Logs\MeasuredBoot\.
WLS reads this information directly via the API and reports it in the order provided by the OS. Known values are decoded where applicable, others are reported in hexadecimal up to the user specified byte count for later analysis. By default, reporting is enabled for the Current Static Root Trust of Measurement (SRTM), reporting for the Boot, Current, or Resume, SRTM or Dynamic Root Trust of Measurement (DRTM) is also available. These can be logged on startup and at a chosen interval to enable tracking over time of variations.
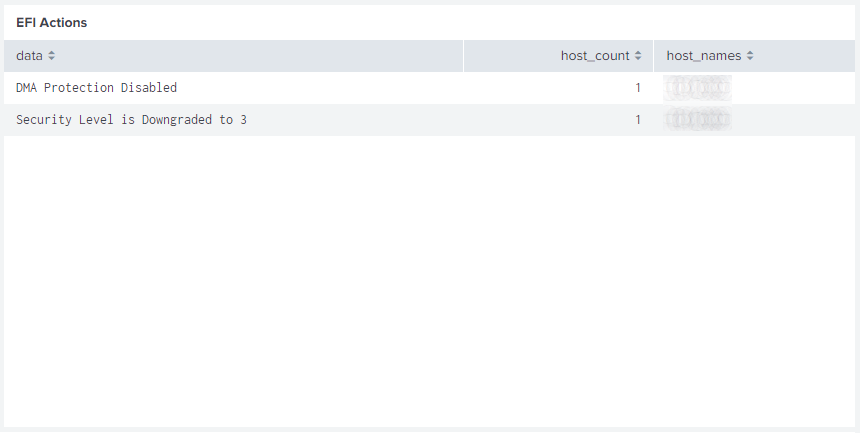
A Splunk dashboard has been created to analyze and decode these logs for comparison across all systems. This includes Early Launch Anti-Malware (ELAM), Bitlocker state and status changes, virtualization based security (VBS), loaded modules, Extensible Firmware Interface (EFI) actions, and more. Known Platform Configuration Registers (PCR) and common acronyms related to the WBCL can optionally be displayed for reference; the System Integrity Platform Attestation (SIPA) definition was surprisingly hard to find.
Rare loaded modules can help locate systems with a non-standard configuration and potentially malware.
EFI actions may show configuration issues and other important information.
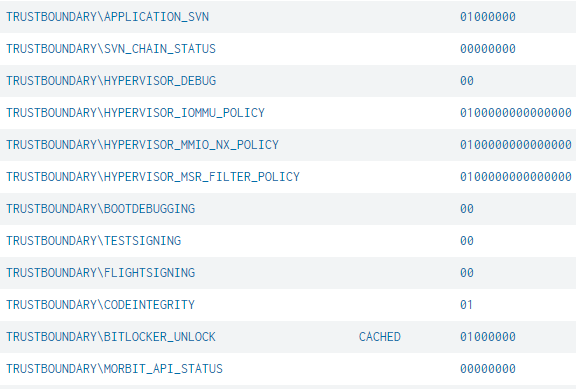
The raw events are shown in-order with decoding for well-known items and hexadecimal to ascii decoding to show readable data where possible. This lets you trace one or more systems through boot process to analyze loaded modules, signing certificates, hypervisor policies, Bitlocker unlock status, and other settings.
This is just one of the new features coming with the WLS 3.7 update; others include shortcut/LNK parsing and reporting for new process events and command line parameters, loaded file system filters (fltmc), HTTP(s) log destinations, and Portable Executable (PE) directory names and values (debug, export, import, etc.).
For more information on WLS, click “WLS Information” at the top, or here: WLS Information
If you’d like licensing or other information about WLS, send me a note via the contact form. WLS is currently available to US entities, but does require a signed license agreement.
WLS 3.7 introduces the ability to read settings from a remote location, optionally based on host attributes. This provides a dynamic way to update settings on hosts without using GPO, and the ability to deploy WLS without a base configuration file (initial.xml), separating the deployment and configuration for easier management in complex environments.
Remote Location
The remote location can be a file share or web site. It is recommended that a file share have proper ACLs applied, specified by FQDN, and DNSSEC enabled. If a web site is used, HTTPS is recommended and must have a valid certificate.
The rules.xml and any qualifying XML settings files are read and cached on the host. At the specified Interval, WLS will check for changes based on the specified UpdateCheckType. File share paths default to checking the Last Modified Date metadata. Web site paths default to checking the Last Modified Date and ETag metadata returned from a HEAD request. UpdateCheckType can be configured to require a full content comparison at each interval. If the metadata has changed a full content comparison is done and settings are only applied if the content has changed.
If the system is unable to reach the remote configuration path, the cached rules.xml will be evaluated and qualifying cached XML settings will be used as the original paths are cached as well.
Rules
The rules.xml must be located at the root of the remote location. Each rule specifies one or more conditions and a URL to read settings from for hosts that match all conditions. The URL can be relative to the remote location or an absolute path to another location. URLs evaluated from the rules.xml can contain XML settings files by any name. A rule can be set to stop processing further rules by setting continue to false.
Conditions
A condition can either be a “host” or “wmi” condition. A host condition can be the hostname, OU, DN, or any environmental variable for the “Local System” user. A WMI condition can use any WMI namespace and class available to “Local System”.
Each condition can specify one or more fields. Each field can specify zero or more values. Each value can be an exact match, wildcard (*, #, ?), or regular expression. For fields where more than one value may be returned, each value is compared against the values specified. If no value is specified all values will be used when evaluating tokens.
Tokens are optional and can be specified for one or more fields. The token can then be used as part of the URL to dynamically change the location or file name of the XML settings file to be read if all conditions are met.
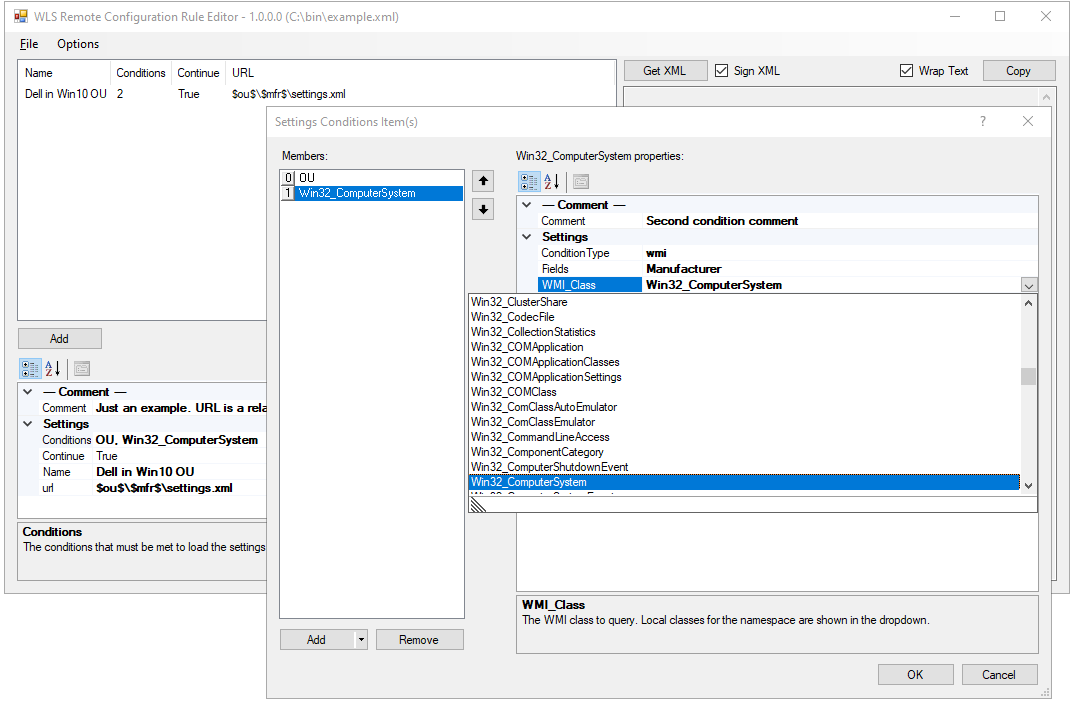
Example rules.xml
The example below shows reading settings for a Dell computer in an OU named “Windows 10”. The URL is relative and based on the tokens from the conditions.
<WLS>
  <rules>
    <rule name="Dell in Win10 OU">
      <!--Just an example. URL is a relative path to RemoteConfigurationURL-->
      <host>
        <!--Example condition comment-->
        <fields>
          <field>
            <!--Example field comment-->
            <name>OU</name>
            <!--Example value comment-->
            <value>Windows 10</value>
            <token>ou</token>
          </field>
        </fields>
      </host>
      <wmi>
        <namespace>root\cimv2</namespace>
        <class>Win32_ComputerSystem</class>
        <!--Second condition comment-->
        <fields>
          <field>
            <!--wmi field comment-->
            <name>Manufacturer</name>
            <value>Dell*</value>
            <token>mfr</token>
          </field>
        </fields>
      </wmi>
      <url>$ou$\$mfr$\settings.xml</url>
    </rule>
  </rules>
</WLS>
This example shows reading settings for any manufacturer in the “Windows 10” OU. No value needs to be specified if all values for a field will be used. Failed attempted paths will be logged based on the LogMissingFiles setting.
<WLS>
  <rules>
    <rule name="Dell in Win10 OU">
      <!--Just an example. URL is a relative path to RemoteConfigurationURL-->
      <host>
        <!--Example condition comment-->
        <fields>
          <field>
            <!--Example field comment-->
            <name>OU</name>
            <!--Example value comment-->
            <value>Windows 10</value>
            <token>ou</token>
          </field>
        </fields>
      </host>
      <wmi>
        <namespace>root\cimv2</namespace>
        <class>Win32_ComputerSystem</class>
        <!--Second condition comment-->
        <fields>
          <field>
            <!--wmi field comment-->
            <name>Manufacturer</name>
            <token>mfr</token>
          </field>
        </fields>
      </wmi>
      <url>$ou$\$mfr$\settings.xml</url>
    </rule>
  </rules>
</WLS>
Settings
A settings.xml may be located at the root of the remote location. If present it will be applied to all hosts. XML settings file content is the same format as the initial.xml and the WLS Configuration Editor should be used to generate them. Settings files are processed in the order they appear in the rules.xml. Settings are overlaid such that the last setting will overwrite a previous setting.
XML Integrity and Verification
XML files should be digitally signed to ensure content has not changed. XML files can be signed with a certificate to ensure the content integrity and that it was signed by a trusted entity. The tooling to sign and verify is included with the Remote Configuration Rule Editor and the Configuration Editor.
Signing
From either tool, choose File->Sign XML. A prompt will appear asking if you have a certificate, choosing Yes will show the available certificates or let you choose one from disk and ask for the PIN/password if needed, choosing No will use a system generated certificate. Each tool can also have a default certificate chosen to avoid being prompted.
A system generated certificate will verify the content only. A user specified certificate will verify content and that the signer is trusted by the host. After signing a verification is performed and the results displayed to the user.
A signature block will be added to the end of the XML file. Any previous signature will be removed.
WLS can be deployed without an initial.xml by specifying a RemoteURL as a command line parameter to msiexec.exe. The rules.xml must be signed when specified at installation.
The Remote Configuration Rule Editor is provided to help with creating the rules.xml file. XML is the native format used and it can be edited without the use of the editor. If the file is signed, editing the file will invalidate the signature until it is resigned for the new content. Rule names and any comments are for user reference only and are not used by WLS.
Rules are added and removed using the appropriate buttons. Rules can be reordered by dragging and dropping.
Where possible the editor will show available field names, values, WMI namespaces, and WMI classes. Field names, namespaces, and classes are free-form text fields and can specify values not available on the local system that may be available on other systems.
Available “host” fieldsAvailable WMI classesAvailable WMI fields for the namespace and class
Logs and Dashboard
All relevant Remote Configuration activity is logged and a Splunk dashboard is provided in the WLS App for Splunk.
For more information on WLS, click “WLS Information” at the top, or here: WLS Information
If you’d like licensing or other information about WLS, send me a note via the contact form. WLS is currently available to US entities, but does require a signed license agreement.
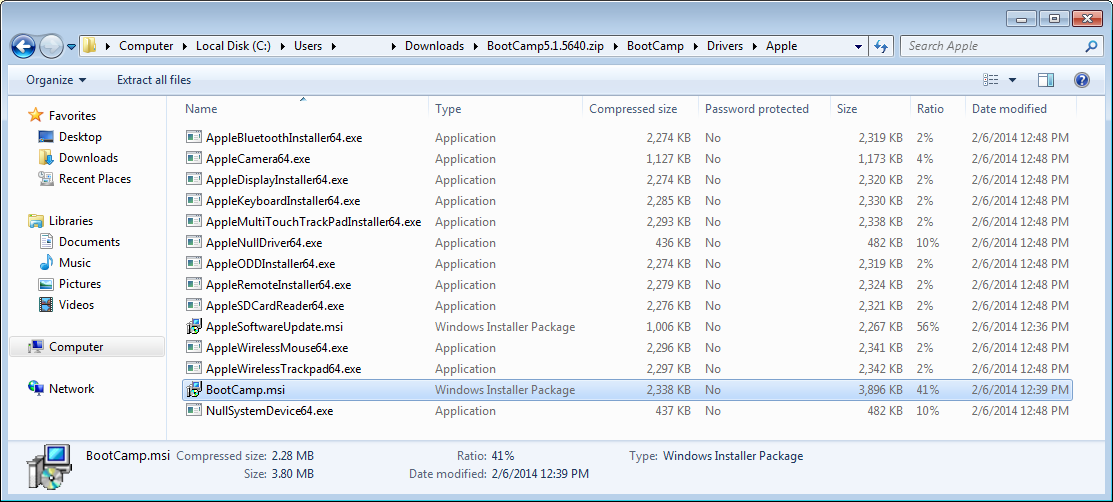
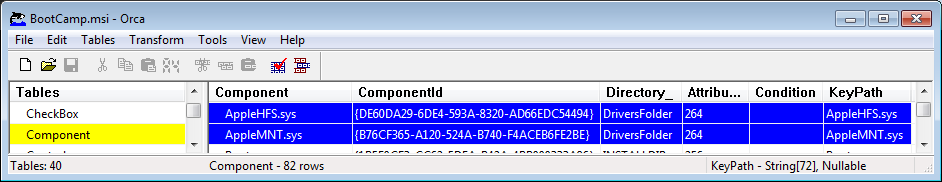
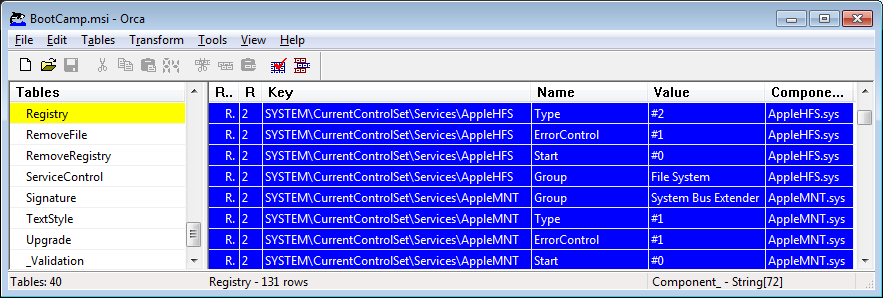
Recently I had a coworker request the ability to read an HFS+ formatted drive with Windows. I found a few scattered articles that pointed to Apple’s “Boot Camp Support Software” including an HFS+ driver, and it does.
How to add read only HFS+ support to Windows (64-bit) using Apple’s HFS+ drivers
Download the latest “Boot Camp Support Software”
Search the Apple support site for “boot camp support software”
The method presented below can be used to track any log attribute in Splunk; this example demonstrates watching MD5 hashes of executed files and loaded modules.
I’ve enabled Process Auditing via the Group Policy Editor and configured WLS to provide MD5 hashes.
I also enabled the “ModuleMonitor” in WLS which tracks loaded modules by process
and configured it to provide MD5 hashes for these as well.
Now that we are receiving hashes for all executed files and loaded modules, let’s start tracking them in Splunk.
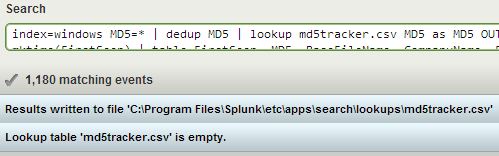
First we’ll need to create a lookup table, there are a few ways to do this, a quick way is simply:
| outputlookup md5tracker.csv
This will create an empty csv file named “md5tracker.csv”.
Next, we need to search for and add the desired data to the csv file. I like to preserve some of the metadata that WLS reports with each record for later use – avoid re-searching, etc.
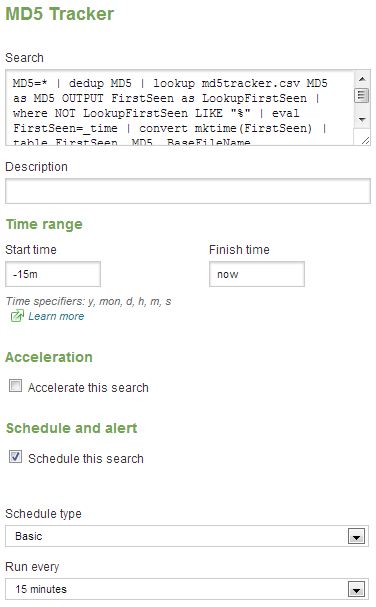
index=windows MD5=* | dedup MD5 | lookup md5tracker.csv MD5 as MD5 OUTPUT FirstSeen as LookupFirstSeen | where NOT LookupFirstSeen LIKE “%” | eval FirstSeen=_time | table FirstSeen, MD5, BaseFileName, CompanyName, FileDescription, FileVersion, InternalName, Language, Signed, Length | inputlookup md5tracker.csv append=t | dedup MD5 | outputlookup md5tracker.csv
OK, let’s break this down:
Find the desired records: index=windows MD5=*
Remove duplicates: dedup MD5
Lookup the MD5s in our lookup table, returning the date first seen: lookup md5tracker.csv MD5 as MD5 OUTPUT FirstSeen as LookupFirstSeen
Remove records that already exist (field will be non-null): where NOT LookupFirstSeen LIKE “%”
Preserve the time stamp as desired output field: eval FirstSeen=_time
Format the desired fields into a table: table FirstSeen, MD5, BaseFileName, CompanyName, FileDescription, FileVersion, InternalName, Language, Signed, Length
Bring all the old data in and append it: inputlookup md5tracker.csv append=t
Remove duplicates (just in case): dedup MD5
Write out the new + old data: outputlookup md5tracker.csv
After the first run, you should have the results from your chosen time period now stored in md5tracker.csv
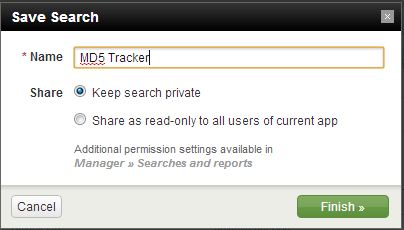
You’ll want to save this search
and schedule it to run every x minutes for the last x minutes; I schedule mine for every 15 minutes.
Once this is complete you’ll now have a search that keeps your lookup table up-to-date. Now what?
What you do next depends on how closely you feel this needs monitored. I run a second search every x minutes that alerts on all new entries in the last x minutes (based on the FirstSeen) field.
This simply take the entire table and selects all entries in the last 2200 seconds (2200 / 60 = 36.6 minutes) and formats the results into a table. I scheduled it to run every 35 minutes with some overlap time (hence 2200 instead of 2100).
I also like to take an export of the hashes every so often and check them against Team Cymru’s malware hash registry – https://hash.cymru.com/
| inputlookup md5tracker.csv | table MD5
Export the results from Splunk, open the file in a spreadsheet, and copy/paste them into Team Cymru’s lookup for a quick analysis. An enterprising person might also create a custom Splunk command that uses their DNS lookup service (https://www.team-cymru.org/Services/MHR/#dns) and puts the results into the lookup table itself…
I currently have 23,537 executable hashes and 131,885 module (dll, etc) hashes, and see a few new ones at most search intervals during normal business hours. After the initial gathering, the periodic alerts are easy to quickly review, and you’ll know everything that is running on your Windows hosts.
So, you’ve got the latest list of IOCs from a recent APT / malware report, time to kick off the scanner(s) / agent(s) of you choice and wait for the results. Wouldn’t it be nice to do a quick search of your logs and have the answer in seconds? You’re already collecting logs from your Windows hosts (right?), shouldn’t they be doing more for you than providing logs?
Windows logging tools seem to have been stuck for a while at providing just the logs. The Splunk Universal Forwarder is an excellent example of a free, modern logging tool that does more than logs, and works with more than the Splunk server (hint hint); but even it does not provide what I believe is necessary data to support cyber security, forensics, and incident response.
Why not collect process hashes, named pipes, mutexes, semaphores, loaded modules, etc., and send them with the logs? Why not have these in real-time and be able to search your entire enterprise in seconds? There are plenty of server-side tools to collect, parse, and index all of your logs; hosted on or off-site, free or pay. So, why not? You could know within minutes every new binary that is executed, including it’s metadata. You could know the initial infection vector, have the IOCs immediately, search all your hosts simultaneously, and that’s just the beginning!
Not finding a tool (at the time) that did what I wanted, I created WLS to provide exactly that; logs and the extra data to support answers I needed. There may be other programs that do this now (I’d love to know!), and I hope that others find this data as useful as I do.
Here are some WLS logs that answer example questions:
What did Firefox launch today that was downloaded from the internet?
WLS can also log the following information to your log server:
Certificates
Devices
Drives
File system changes – including file metadata
Listening and connected ports, with associated process information
Loaded modules – including file metadata
Mutexes, semaphores, and other Windows objects
Named pipes
Optical media used
Performance counters
Registry changes
WMI information
I’ll cover the details of each of these features and configuration examples in upcoming posts, as well as provide example Splunk searches I use for day-to-day operations.
If you’d like more information on WLS, send me a note via the contact form. WLS is currently available to US entities, but does require a signed license agreement.