The method presented below can be used to track any log attribute in Splunk; this example demonstrates watching MD5 hashes of executed files and loaded modules.
I’ve enabled Process Auditing via the Group Policy Editor and configured WLS to provide MD5 hashes.

I also enabled the “ModuleMonitor” in WLS which tracks loaded modules by process

and configured it to provide MD5 hashes for these as well.

Now that we are receiving hashes for all executed files and loaded modules, let’s start tracking them in Splunk.
First we’ll need to create a lookup table, there are a few ways to do this, a quick way is simply:
| outputlookup md5tracker.csv
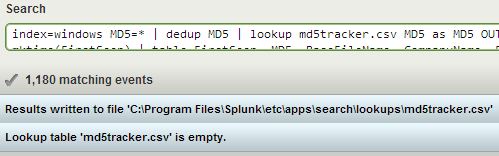
This will create an empty csv file named “md5tracker.csv”.

Next, we need to search for and add the desired data to the csv file. I like to preserve some of the metadata that WLS reports with each record for later use – avoid re-searching, etc.
index=windows MD5=* | dedup MD5 | lookup md5tracker.csv MD5 as MD5 OUTPUT FirstSeen as LookupFirstSeen | where NOT LookupFirstSeen LIKE “%” | eval FirstSeen=_time | table FirstSeen, MD5, BaseFileName, CompanyName, FileDescription, FileVersion, InternalName, Language, Signed, Length | inputlookup md5tracker.csv append=t | dedup MD5 | outputlookup md5tracker.csv
OK, let’s break this down:
Find the desired records: index=windows MD5=*
Remove duplicates: dedup MD5
Lookup the MD5s in our lookup table, returning the date first seen: lookup md5tracker.csv MD5 as MD5 OUTPUT FirstSeen as LookupFirstSeen
Remove records that already exist (field will be non-null): where NOT LookupFirstSeen LIKE “%”
Preserve the time stamp as desired output field: eval FirstSeen=_time
Format the desired fields into a table: table FirstSeen, MD5, BaseFileName, CompanyName, FileDescription, FileVersion, InternalName, Language, Signed, Length
Bring all the old data in and append it: inputlookup md5tracker.csv append=t
Remove duplicates (just in case): dedup MD5
Write out the new + old data: outputlookup md5tracker.csv
After the first run, you should have the results from your chosen time period now stored in md5tracker.csv
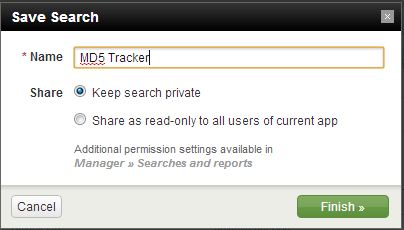
You’ll want to save this search
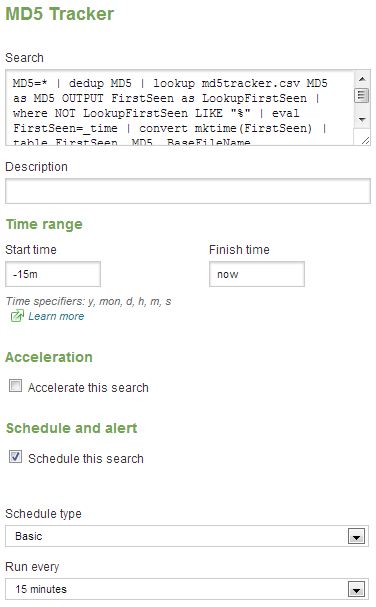
and schedule it to run every x minutes for the last x minutes; I schedule mine for every 15 minutes.
Once this is complete you’ll now have a search that keeps your lookup table up-to-date. Now what?
What you do next depends on how closely you feel this needs monitored. I run a second search every x minutes that alerts on all new entries in the last x minutes (based on the FirstSeen) field.
| inputlookup md5tracker.csv | where now()-FirstSeen < 2200 | table FirstSeen, MD5, BaseFileName, CompanyName, FileDescription, FileVersion, InternalName, Language, Signed, Length
This simply take the entire table and selects all entries in the last 2200 seconds (2200 / 60 = 36.6 minutes) and formats the results into a table. I scheduled it to run every 35 minutes with some overlap time (hence 2200 instead of 2100).

I also like to take an export of the hashes every so often and check them against Team Cymru’s malware hash registry – https://hash.cymru.com/
| inputlookup md5tracker.csv | table MD5
Export the results from Splunk, open the file in a spreadsheet, and copy/paste them into Team Cymru’s lookup for a quick analysis. An enterprising person might also create a custom Splunk command that uses their DNS lookup service (https://www.team-cymru.org/Services/MHR/#dns) and puts the results into the lookup table itself…
I currently have 23,537 executable hashes and 131,885 module (dll, etc) hashes, and see a few new ones at most search intervals during normal business hours. After the initial gathering, the periodic alerts are easy to quickly review, and you’ll know everything that is running on your Windows hosts.

Great stuff!
To comment on the end, you can always install the “getwatchlist” Splunk app and monitor the Cymru’s Hash database automatically in Splunk. Then do the comparison right in the Splunk search — much easier and automatic!
Thanks! I’d forgot about that app…
@Digirati82:
Mind updating the article with the mentioned module when you have a chance?
If I get a chance to try it out, I definitely will.
Thanks! Really good stuff!
But I can’t to find any info about WLS (no value in registry), can you get any links to read about it? How to install it?
It’s some software that I’ve developed, which I hope to make available more widely soon. I’ll post more details on my blog when it’s publicly available. Thanks for the interest!
can’t wait! WLS looks extremely useful for a large number of scenarios
Isn’t process tracking generating a massive amount of events in Splunk? Do you have any numbers on that?
Process tracking does indeed generate quite a few logs. What I found though was that log forwarders such as Snare and the Splunk Universal Forwarder send the old style logs with white space and the MS description of the event every time. Since WLS parses all logs into key/value pairs, eliminating that narrative, even with the (optional) extra data, there was less data being indexed. Currently, with the majority of optional data included – watching loaded modules, mutexes, semaphores, process tracking, hashing, etc – I see an average of < 5MB / day / host (total). I did a quick check for a single day and saw ~1750 process creation/termination logs per host in a 24 hour period. Also, the data being provided is extremely useful not just for finding new binaries, but checking for people using old / vulnerable software, watching new software roll-outs, and of course, tracking malicious activity.
Pingback: Using Splunk to watch for new binaries | Big Da...
Pingback: Using Splunk to watch for new binaries | d@n3n ...